Speaker/Author: Howard Zion Company: Transcat, Inc. 35 Vantage Point Drive, Rochester, NY 14624 Phone: 714-742-2697; Email: [email protected] Co-Author: Alejandro Bautista
Have you ever played one of those ‘spot the difference’ picture puzzles? How many can you find in the pictures1 below? The differences are right there in front of us. How is it that we think we see so clearly but then discover that there’s more to it than meets the eye?
Now imagine trying to spot the difference for a concept rather than a picture. Example: an equipment owner reviews calibration certificates from two suppliers in an attempt to spot the differences. Some of the differences could be evident when comparing the columns of information. But what about determining the difference between the standards used, the measurement uncertainty, or the qualifications of the technician? The task becomes exponentially more difficult, especially if you don’t even know to look for a difference. This can lead to potential Quality Blind Spots ™2 in industrial manufacturing that can cause false acceptance/rejection of product or increase a company’s costs. There are many QBS ™which I have introduced in some of my other papers, presentations, and training sessions. Allow me to present another one: Tolerancing Bias. Tolerancing Bias is the incorrect application of tolerances for instruments that contain a percent of reading component in their specifications. This concept was brought to my attention by one of Transcat’s FDA-regulated clients, Stanley Flores. When Stan called me, he prefaced the conversation with, “I need to get your opinion on something I think I’m seeing, but not sure it’s right. It’s difficult to explain, so bear with me.” We spent the next hour discussing this QBS ™At first, I couldn’t see it. And it wasn’t because Stan wasn’t explaining it well. It’s just that I had my ‘Metrology goggles’ on, which I had been wearing for over 34 years at that time. I had to take those off and put on my ‘Customer goggles’. The crazy thing about that is, I pride myself in standing in the ‘customer’s shoes’ to gain a different perspective. Having done so, I have discovered potential avenues for QBS ™ . Then I would scrutinize each situation with my Metrology lenses to see whether or not it caused a disconnect that opened the door for measurement risk. So the problem wasn’t the ‘shoes’; it was the ‘Metrology goggles’ that created a bias and caused me to be blind to this particular QBS ™! Patience persevered and Stan finally got me to ‘spot the difference’.
In this paper, we will describe the difference between an accuracy specification and a tolerance, explain how to convert a spec to a tolerance, cover the typical method that calibration labs use to apply the tolerance to a calibration result, and then we will introduce a different perspective from the equipment user’s point of view. The expected outcome of this paper is for the reader to understand how a bias has been introduced which causes false acceptance/false rejection of calibration results as well as how to avoid this QBS ™. And, by the way, there are ten differences between the two pictures.
Foreward
When performing a calibration, it is sometimes advantageous to set the Metrology standard to the nominal value (Snom) and then report the value of the Unit Under Test (UUT). But for other applications it is more efficient to set the UUT to nominal (Unom) and report the value of the standard.
An example of Snom is the use of a pressure calibrator that can be programmed to specific set points in the process of calibrating an analog pressure gauge. The analog gauge cannot be programmed so it makes sense to take advantage of the pressure calibrator’s menu and controller features to pressurize the standard to pre-determined values across the range of the UUT, making it simple for the calibration technician to simply wait for stabilization and then enter the value indicated on the pressure gauge. Alternatively, the pressure calibrator could automatically reach a value just below the set point allowing the technician to take it out of the control mode and then bump the pressure up until the gauge reads the nominal value and then enter the standard’s actual value into the cal report. But that is not as efficient.
An example of Unom is a weight with a nominal mass value where, depending on the class of the weight, a single substitution or a double substitution method is employed using a standard mass and a comparator to identify the value of the UUT mass. Other examples of Unom include: gage block, pin/plug/ring gage, roughness specimen, angle block, et.al. Basically any artifact that sources a value and is not readily adjustable by the operator.
Foundation
In April 2017 I received an email from one of my customers, Stanley Flores at W. L. Gore & Associates, with whom I have built a good rapport over the years, both from a clientsupplier perspective and through professional organizations such as NCSL International and the Measurement Science Conference. Stanley stated that he had recently come across a dispute regarding the application of specifications and calculating Pass/Fail limits. He had found some white papers on the subject and, after reading these, was “falling down the rabbit hole” and wanted to bump the situation up against someone to see if he could get more clarity. Stanley’s instrument (i.e., the UUT) is a flow device. The calibration report he received from the supplier indicated his instrument was found Out Of Tolerance (OOT). One of the OOT points was at the 75 lph (liters per hour) test point.
In his due diligence to review the cert for omissions and/or errors, Stanley looked up the Original Equipment Manufacturer’s (OEM) specification to confirm the tolerances were calculated correctly.
Specifications can be written as an accuracy statement, as shown in figure 2. However, some instrument specifications are written directly as a tolerance, such as a 0.5 inch Class X pin gage, which per the ANSI/ASME B89.1.5 standard is ±0.000040 inch, or ±40 μin. If a specification is stated as a percentage or in parts per thousand or parts per million, some math must be performed in order to convert it to a tolerance in the engineering unit of the UUT. In this case, Stanley’s math resulted in the following tolerance:
Could it be the supplier made a mistake in their math or in the application of the tolerance? Could this be a Snom vs. Unom phenomenon? Did Stanley spot a quality difference?
Being an experienced Metrology Engineer (now a Sr Quality Engineer at Alcon Surgical Division) Stan quickly determined that the supplier calculated the tolerance based upon the Standard’s value and then applied it around the Standard’s value. This is a Standardcentric tolerance window as opposed to the UUT-centric tolerance window that Stanley had calculated. A quick check of the math confirmed the supplier’s tolerance:
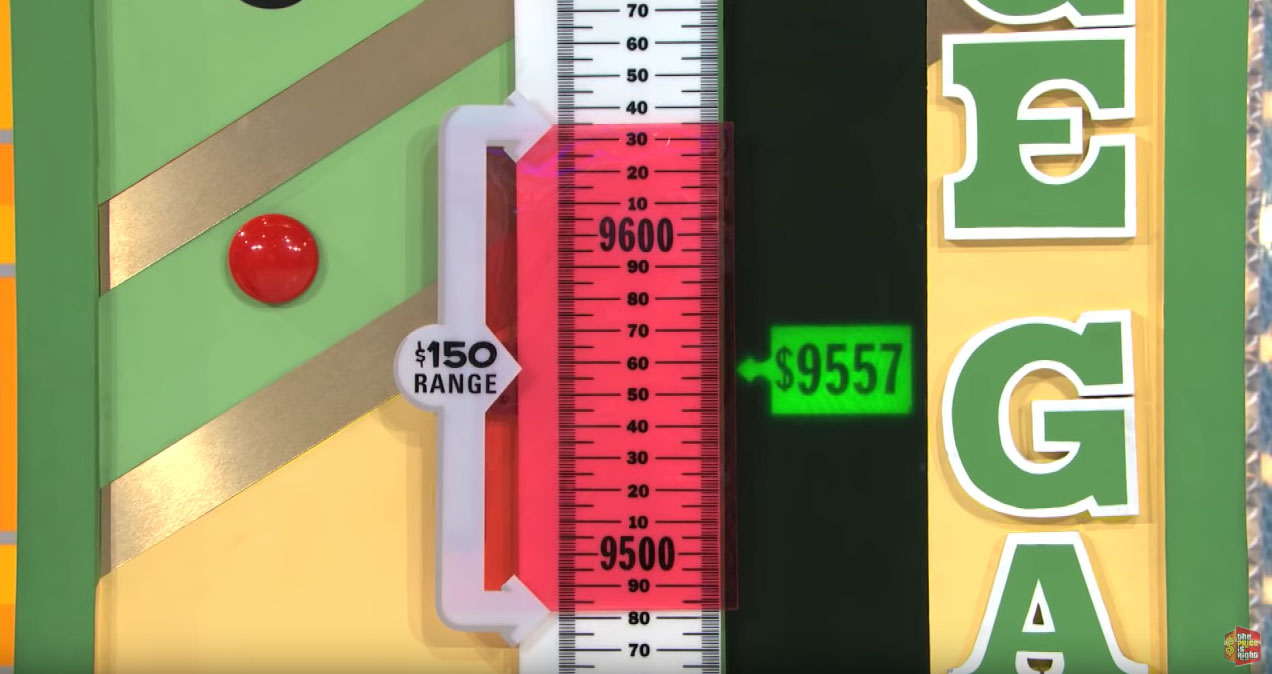
Similarly, the flow device indicates a value for the operator when it is being used to quantify the unknown flow of a process. And the equipment operator realizes that the flow value indicated on the flow device quantifies that value for the process but that it has a “Range” window within which the ‘true’ value is expected to lie, as determined by the OEM’s performance specification. When the flow device is submitted for calibration, the Range window does not change; the ‘true’ value is simply revealed by the standard (i.e., symbolically, the green value in fig. 3). If the standard’s value lies within the Range window, the UUT is In Tolerance (i.e., the customer wins). If not, the UUT is OOT (i.e., the customer loses). The Range window is still the tolerance window defined by the OEM, as applied to the indication on the flow device, not the indication of the standard.
With this in mind, it seems to me that the Metrology world is, in many instances, ‘doing it wrong’ when it comes to the application of UUT specifications for percentage-ofindication- type specs. Another thought that crossed my mind is this: for UUTs that have solely a % Range spec, has there ever been a question as to whether this should be calculated as a percentage of the UUT’s range as opposed to it being a percentage of the standard’s range? Probably not. I’m thinking most, if not all, cal labs apply a UUT’s % Range spec as a UUT-centric tolerance and not a Standard-centric tolerance. So then why would % Reading be applied any differently?! It should not. For Gore’s flow device the tolerance window developed by the OEM of the flow device is literally:
− (2.5% Reading of the flow device + 0.01% Range of the flow device) but is not: − (2.5% Reading of your flow standard + 0.01% Range of the flow device) Similarly, for the calibration of your flow standard the tolerance window is literally: − (1% Reading of your flow standard + 0.01% Range of your flow standard) but is not: − (1% Reading of your cal supplier’s primary flow standard + 0.01% Range of your flow standard).
The OEM develops a performance spec for the instruments they produce so that their clients know what to expect from the instrument. That spec isn’t written for the standard(s) that are used to calibrate the instrument. Therefore, within the calibration process the UUT spec should always be applied to the UUT’s reading/range to determine the tolerance window and then the standard’s value along with its corresponding measurement uncertainty should simply be evaluated to fall within that tolerance window or outside of it for Pass/Fail evaluation. Cal labs must remove their Standard-centric tolerancing bias, if it exists, because a Standard-centric tolerance has the possibility of creating a False Reject, as occurred in this flow device example.
Summary
Tolerancing Bias is one of many Quality Blind Spots™ that can cause False Accept/False Reject results. Most QBSs are unintentional but, in the end, still result in a burden to the calibration customer for measurement risk and associated costs. Identifying and eliminating or minimizing these measurement risks is the responsibility of Measurement Science professionals working closely with their customers to understand their calibration needs.
For labs that have been applying a Standard-centric tolerance window, there is certainly a cost implication for this type of corrective action. Calibration tolerances must be changed for hundreds if not thousands of calibration data sheets across many internal labs as well as many commercial labs. As with the identification of any massive error, the most acceptable way to do this is to work through these changes as each data sheet is used until the problem has been fully resolved.
Another consideration is that other uncertainty components must be taken into account (i.e., the expanded measurement uncertainty surrounding the Standard’s reported value), which would potentially change the outcome of the Pass/Fail decision and which also requires the equipment owner to identify their decision rules for False Accept/False Reject decisions. Alas, that is (was) a topic for another paper4.
And finally, a big Thank You to Stanley Flores for helping me (and all who read this paper) to ‘spot the difference’!
References
[1] Spot-the-Difference pictures provided by Coolmath Games (https://www.coolmathgames.com/0-spot-the-difference)
[2] Quality Blind SpotTM is a trademark of Client Focus Group, LLC and reprinted with permission.
[3] Range Game picture and video is a copyright of The Price Is Right game show, owned by Fremantle.
[4] Source: Who’s Making the Decisions About Your Decision Rule by H. Zion, NCSLI 2010, Providence, RI
About the authors:
Howard Zion is the Director of Service Application Engineering for Transcat, Inc. He holds a B.S. in Engineering Technology and a M.S. in Industrial Engineering & Management Systems from the University of Central Florida. Howard has collected a wealth of knowledge in many disciplines during the span of 36 years in Metrology, and has been employed with:
The United States Air Force (Strategic Air Command - PMEL)
Lockheed Martin (Electronics and Missile Systems – Calibration Labs)
NASA-Kennedy Space Center (Standards & Calibration Laboratories)
Alex Bautista is the West Regional Manager, Client Based Laboratory Operations at Transcat, Inc. He holds a B.S. in Business Organizational Innovation from the University of Phoenix. Alex has 20 years of experience in Metrology. He began his career in the United States Marine Corps at MALS 39 in Camp Pendleton and has been employed by Transcat, Inc for the last 15 years.
Contact Information
Howard Zion Director of Service Application Engineering Transcat, Inc. 35 Vantage Point Drive • Rochester, NY 14624 www.Transcat.com Cell: 714.742.2697 [email protected]